US Household Net Worths and Incomes Drop - Time for a New Calculator!
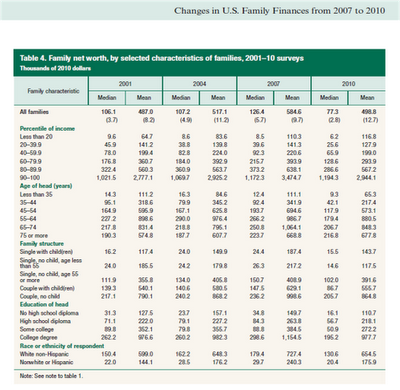
A federal report was released last week telling how the median US household has gone down in both income and net worth from 2001 to 2010. The median household is down from a net worth of $106,100 and an income of $48,900 in 2001 to a worth of $77,300 and an income of $45,800 in 2010. Net worth had actually been increasing well through 2007 ($126,400 median net worth then) primarily due to the increase in housing prices, but with the housing price bubble popping along with the decline in the financial markets net worth is down from that peak.
What does this all mean? It means that it is time for a new online calculator! I saw another nicely written article on Scott Burn's AssetBuilder web site which included a nice table of percentiles, so I wrote up a new calculator so anyone can find your own percentile ranking in both 2001 and 2011. It uses linear interpolation to calculate all the percentiles between 0, 20, 40, 50, 60, 80 and 90 for income, and from 0, 25, 50, 75 and 90 for net worth. Once you are above the 90 percentile point for either income or net worth that is as high as it goes. Sorry, the article did not have the 99th percentile levels for each one (i.e. the Top 1 percenters.) I would need the income and net worth 99th percentile numbers for both 2001 and 2010, and I could not find those available. In any case it is interesting to compare the different percentiles for both dates to see how your own situation changed over the past decade.
What does this all mean? It means that it is time for a new online calculator! I saw another nicely written article on Scott Burn's AssetBuilder web site which included a nice table of percentiles, so I wrote up a new calculator so anyone can find your own percentile ranking in both 2001 and 2011. It uses linear interpolation to calculate all the percentiles between 0, 20, 40, 50, 60, 80 and 90 for income, and from 0, 25, 50, 75 and 90 for net worth. Once you are above the 90 percentile point for either income or net worth that is as high as it goes. Sorry, the article did not have the 99th percentile levels for each one (i.e. the Top 1 percenters.) I would need the income and net worth 99th percentile numbers for both 2001 and 2010, and I could not find those available. In any case it is interesting to compare the different percentiles for both dates to see how your own situation changed over the past decade.


Comments